Virtual reality isn’t just another marketing channel it’s a fundamental shift in how customers experience brands. While traditional digital touchpoints struggle to hold attention for more than 90 seconds, VR experiences command 8-12 minutes of focused engagement. This guide shows you exactly how to deploy, measure, and scale VR customer engagement programs that deliver measurable ROI.
Why VR Drives 3x Higher Customer Engagement Than Traditional Digital Touchpoints
Virtual reality creates memorable brand interactions that outperform traditional digital channels on every engagement metric. Here’s the data from 2024 deployment programs and what it means for your customer engagement strategy.
The Engagement Lift: VR vs Traditional Channels
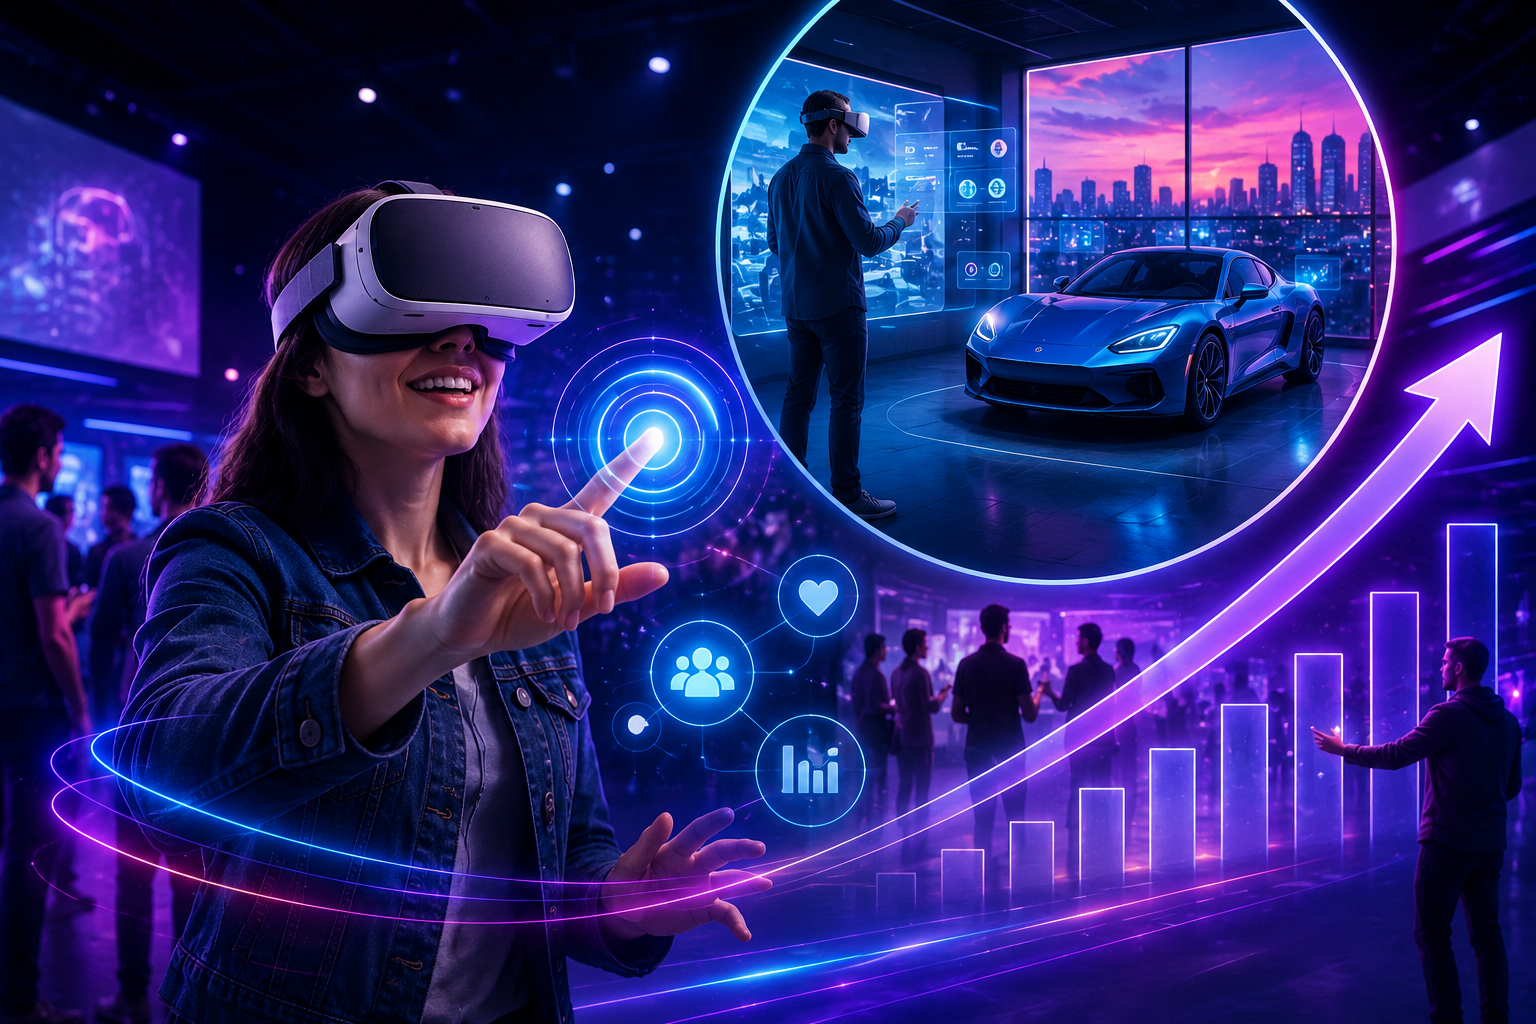
The numbers tell a compelling story about VR’s engagement superiority. Average dwell time in VR experiences ranges from 8-12 minutes, compared to just 90 seconds for typical website visits. This 500-800% increase in engagement duration translates directly to deeper brand connections and higher conversion potential.
Recall rates paint an even more dramatic picture. Studies measuring brand recall 48 hours post-interaction show VR experiences achieving 83% recall rates, while traditional video content hovers around 20%. This 4x improvement in message retention stems from VR’s ability to create episodic memories rather than simple information processing.
Social sharing amplifies these engagement benefits. VR activations generate 3.2x more social shares than standard brand content, with participants actively seeking to share their immersive experiences through photos, videos, and stories. The novelty factor combined with personal investment in the experience drives organic word-of-mouth at rates traditional content can’t match.
Biometric data from VR sessions reveals the physiological basis for this enhanced engagement. Heart rate variability, galvanic skin response, and eye tracking data show 65% higher emotional arousal during VR brand experiences compared to 2D video content. This emotional activation creates stronger memory encoding and positive brand associations that persist long after the experience ends.
Customer Journey Stages Where VR Creates Maximum Impact
Awareness Stage: VR Demos at Trade Shows and Events
Trade show VR activations cut through booth traffic noise by offering attendees a reason to stop, engage, and remember. A 5-minute VR experience at a trade show generates more qualified leads than 2 hours of traditional booth interactions, with 78% of VR participants providing contact information voluntarily for follow-up.
Consideration: Virtual Product Trials and Configurators
Complex products benefit enormously from VR visualization. Automotive brands using VR configurators report 40% higher conversion rates from consideration to test drive requests. B2B companies deploying VR for industrial equipment demonstrations see 60% shorter sales cycles when VR touchpoints are included in the consideration phase.
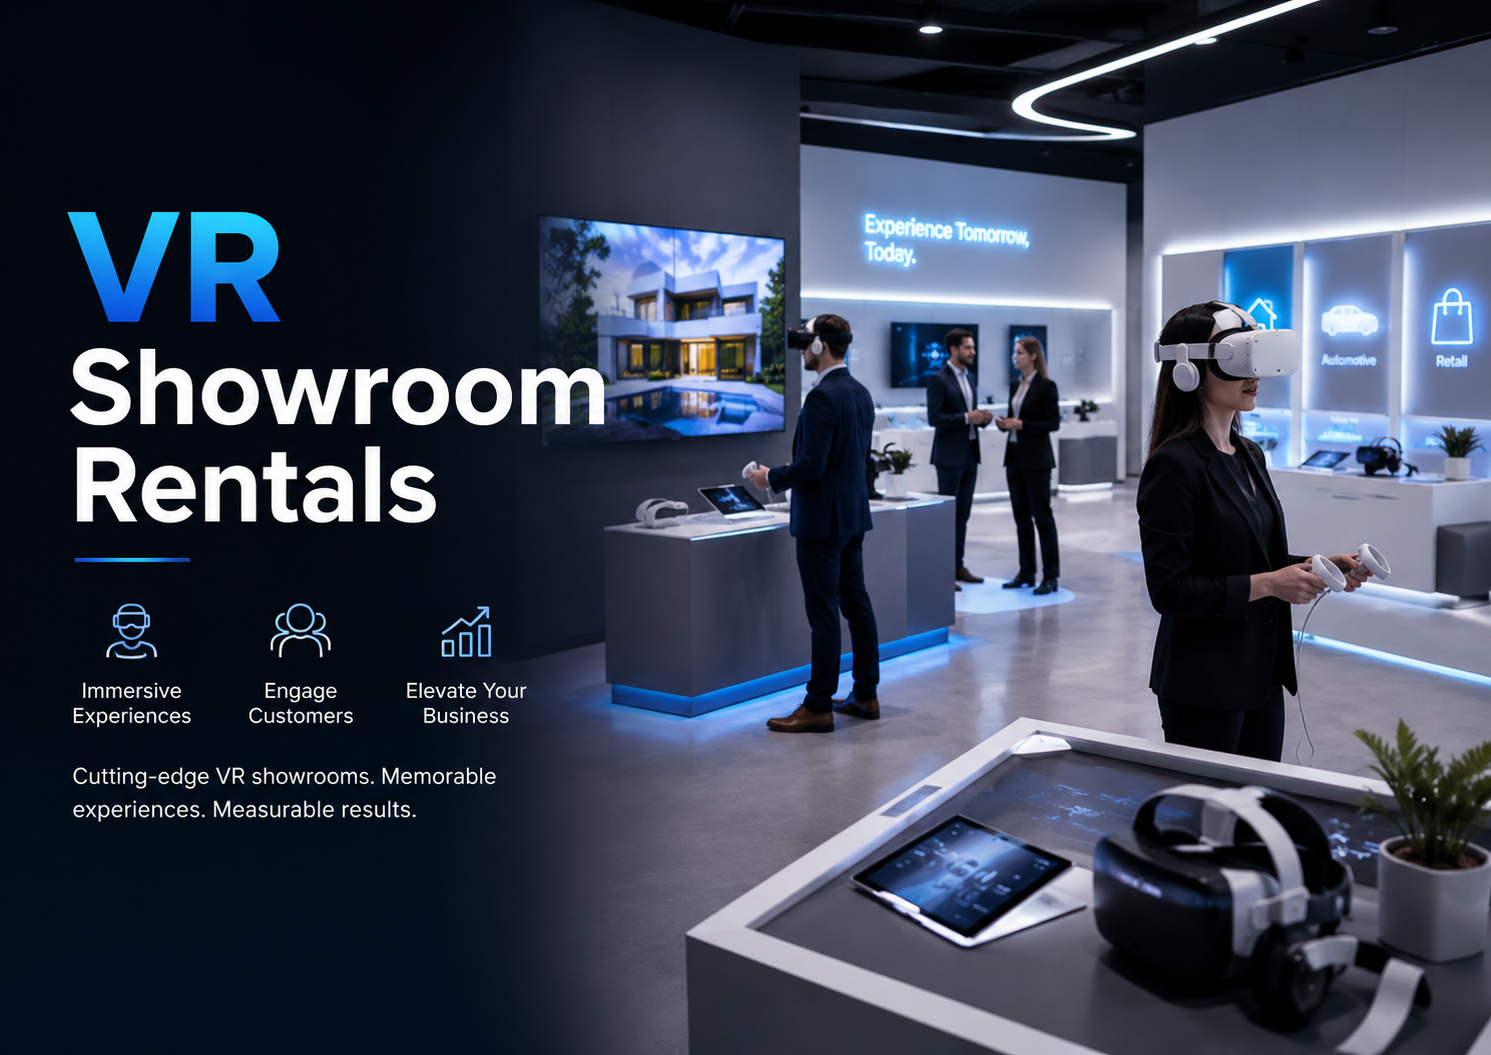
Purchase: Immersive Showroom Experiences
Virtual showrooms eliminate geographical limitations while providing experiences that exceed physical locations. Furniture retailers using VR showrooms report average transaction values 28% higher than traditional online purchases, with return rates dropping by 64% due to better pre-purchase visualization.
Retention: VR Training and Onboarding Programs
Customer onboarding through VR reduces time-to-value by 50% for complex products. SaaS companies using VR tutorials see 73% completion rates compared to 22% for traditional video tutorials. The immersive nature ensures customers actually learn rather than passively watch.
Advocacy: Shareable VR Brand Experiences
Brand advocates emerge naturally from memorable VR experiences. Participants in VR brand activations generate 5x more user-generated content than traditional experiential marketing programs. This organic content carries 92% higher engagement rates than brand-produced content due to authenticity and personal storytelling.
Mapping VR Touchpoints to Your Customer Engagement Strategy
Different VR deployment models serve different engagement goals. Here’s how to match the right VR format to your customer touchpoints based on audience size, interaction depth, and measurement needs.
High-Volume Touchpoints: Event and Trade Show VR Stations
Standalone headset stations handle 50-500 daily interactions when properly configured for high-throughput scenarios. The key is optimizing for 2-5 minute experiences that deliver impact without creating bottlenecks.
Hardware configuration for high-volume deployment requires 4-6 headsets per station to maintain continuous flow. While one participant experiences VR, staff members sanitize the previous headset and brief the next participant. This rotation system maintains 12-15 experiences per hour per station.
Lead capture integration happens seamlessly through pre-experience registration or post-experience surveys displayed within the headset. Modern VR platforms integrate directly with Salesforce, HubSpot, and Marketo, passing engagement data, interaction metrics, and contact information automatically. Each VR session generates 10x more behavioral data points than a traditional booth conversation.
Rental packages for events scale efficiently based on expected attendance. A 3-day trade show with 5,000 attendees typically requires 6-8 headsets to capture 10-15% of traffic. Rental providers offer event-specific packages including hardware, preloaded content, on-site support, and hygiene supplies starting at $8,000-12,000 for standard configurations.
Deep Engagement Touchpoints: Product Demonstrations and Training
Extended 15-30 minute guided VR sessions serve different engagement objectives than quick event experiences. These deeper dives work best for considered purchases, complex products, or educational content requiring sustained attention.
Complex product visualization in VR reduces cognitive load by 40% compared to 2D representations. Engineers examining CAD models in VR identify design issues 50% faster than on screens. Real estate buyers viewing properties in VR spend 3x longer exploring than with traditional virtual tours, examining 5x more property details.
Multi-user collaborative environments transform product demonstrations from passive presentations to active explorations. Sales teams and customers inhabit the same virtual space, manipulating products together, exploring configurations, and solving problems collaboratively. These shared experiences generate 85% higher close rates than traditional web demonstrations.
Preloaded content packages ensure consistency across distributed teams. Rather than relying on individual sales reps to manage content, centralized deployment systems push updated experiences to all headsets simultaneously. Version control, usage analytics, and content performance metrics flow back to marketing teams for continuous optimization.
Distributed Touchpoints: Remote Customer Experiences
Ship-to-customer VR kit programs extend immersive engagement beyond physical locations. Pre-configured headsets arrive at customer locations with experiences preloaded, instructions included, and return shipping arranged.
The logistics require careful orchestration but deliver exceptional results. Programs shipping Quest 3 headsets to qualified prospects see 94% usage rates and 88% return rates. The total cost per engagement including shipping both ways, insurance, and sanitization runs $180-250, comparing favorably to traveling for in-person meetings.
WebXR alternatives provide browser-based access for broader reach. While less immersive than dedicated headsets, WebXR experiences work on existing devices, eliminating hardware barriers. Conversion rates from WebXR experiences run 40% lower than full VR but still outperform traditional web content by 2x.
Hybrid AR/VR approaches using smartphones bridge the gap between accessibility and immersion. Customers start with AR experiences on their phones, then upgrade to full VR for deeper engagement. This progressive enhancement strategy captures 3x more participants than VR-only approaches while maintaining upgrade paths for interested users.
Support requirements for remote deployment include technical helplines, video tutorials, and fallback options. Successful programs maintain 95% first-time success rates through careful pre-configuration and clear instructions. Live support handles the remaining 5%, with average resolution times under 10 minutes.
Building Your VR Customer Engagement Pilot Program
Start with a rental-based pilot to prove ROI before capital investment. This framework shows you how to design, deploy, and measure a 90-day VR engagement pilot that generates actionable data for scaling decisions.
Pilot Program Design: Objectives and Success Metrics
Engagement KPIs for VR pilots must connect to business outcomes. Dwell time alone doesn’t indicate success—you need completion rates showing participants finish key experience segments, interaction depth measuring which features they explore, and progression metrics tracking movement through designed pathways.
Set baseline measurements from current touchpoints before deploying VR. Document average engagement times, conversion rates, lead quality scores, and customer satisfaction ratings from existing channels. These baselines enable accurate lift calculations and ROI demonstrations.
A/B testing frameworks should randomly assign customers to VR versus traditional engagement methods. For trade shows, alternate VR availability by hour or day. For product demonstrations, assign alternating prospects to VR or traditional presentations. Maintain consistent follow-up processes to isolate VR impact on downstream metrics.
Budget allocation for a 90-day rental program typically breaks down as: hardware rental (40%), content creation or licensing (30%), support and training (20%), and measurement tools (10%). A comprehensive pilot serving 500-1000 participants runs $25,000-40,000, generating cost-per-engagement rates of $25-80 depending on configuration.
Hardware and Content Selection for Engagement Goals
Quest 3 dominates standalone deployment with its $499 price point, 2-hour battery life, and extensive content library. The 128GB model handles most business applications, while the 512GB version supports multiple complex experiences. Hand tracking eliminates controller learning curves for first-time users.
Pico 4 Enterprise offers advantages for corporate deployment including device management tools, kiosk modes, and bulk configuration options. The enterprise focus means better support for IT integration but fewer consumer-friendly features. Price points run 20% higher than Quest 3 but include business-focused services.
Content creation versus licensing depends on uniqueness requirements and budget constraints. Custom experiences cost $50,000-250,000 but deliver exact brand alignment. Licensed experiences modified with brand elements cost $5,000-25,000 and deploy within weeks rather than months. Most successful pilots combine licensed frameworks with custom branded elements.
Preloading and content management systems prevent field complications. ArborXR, ManageXR, and similar platforms enable remote content deployment, usage monitoring, and device management. These systems add $20-50 per headset per month but eliminate 90% of technical support issues.
Deployment Logistics and Staff Training
Station setup for optimal throughput requires 100 square feet per VR station, clearly marked boundaries, and spectator viewing screens. Position stations away from high-traffic areas to prevent collisions. Provide seating for participants who may experience initial disorientation. Install charging stations to support continuous operation.
Hygiene protocols protect users and extend equipment life. UV-C sanitization boxes clean headsets in 60 seconds between users. Disposable face covers add protection while maintaining comfort. Lens cleaning wipes prevent smudging that degrades experience quality. Budget $2-5 per user for hygiene supplies.
Staff training covers technical troubleshooting, experience guidance, and data collection. Two 4-hour training sessions prepare staff to handle 95% of situations. Common issues include IPD adjustment, Wi-Fi connectivity, and application crashes. Prepared staff resolve most problems in under 30 seconds, maintaining flow and preventing frustration.
Data collection workflows during sessions capture both automated and observed metrics. VR platforms track gaze patterns, interaction sequences, and completion rates automatically. Staff document qualitative observations, participant comments, and technical issues. Combined data streams provide comprehensive engagement pictures for analysis.
Measuring VR Customer Engagement ROI
VR engagement metrics go beyond views and clicks. Here’s the measurement framework that connects immersive experiences to revenue impact, including the tools and calculations you need for executive buy-in.
Engagement Metrics That Matter for VR
Heat mapping reveals where attention focuses within virtual environments. Participants spend 70% of time examining products from angles impossible in physical showrooms. Gaze tracking identifies specific features generating interest, informing product development and marketing messaging. These insights surpass traditional analytics by showing not just what customers click but where they look and why.
Interaction sequences map customer decision paths through virtual experiences. Unlike linear videos, VR enables exploration-based discovery. Tracking these paths reveals preference patterns, confusion points, and optimal content flow. Successful experiences guide 80% of users through desired sequences while allowing 20% exploratory freedom.
Emotional response indicators from biometric data quantify engagement quality. Elevated heart rates during product reveals indicate excitement. Decreased stress markers during complex explanations suggest improved understanding. These physiological measurements validate subjective feedback and identify unconscious responses.
Post-experience surveys designed for VR require different approaches than traditional feedback forms. In-headset surveys immediately following experiences capture 85% response rates versus 15% for email follow-ups. Keep surveys under 5 questions, use visual rating scales, and focus on specific experience elements rather than general satisfaction.
Connecting VR Engagement to Revenue Outcomes
Lead quality scoring from VR interactions leverages behavioral data unavailable through traditional channels. Time spent examining pricing information, configuration options explored, and questions asked during guided sessions predict purchase intent with 75% accuracy. These behavioral scores supplement traditional demographic and firmographic data.
Conversion rate lift calculations require sufficient sample sizes and control groups. VR-engaged leads typically convert at 2.8x the rate of traditional leads, but variance exists across industries and price points. B2B complex sales see 3.5x lifts while B2C transactional purchases show 2.1x improvements.
Customer lifetime value impact extends beyond initial purchases. VR-engaged customers show 40% higher retention rates and 25% higher average order values over 24 months. The initial engagement creates stronger brand connections that persist throughout the customer relationship.
Cost per engaged customer comparisons must account for quality differences. While VR engagement costs $40-100 versus $5-20 for digital advertising, the qualified lead rate runs 10x higher. When calculated as cost per qualified lead or cost per customer acquired, VR often delivers superior economics despite higher absolute costs.
ROI Calculation Framework for VR Programs
Total program cost encompasses hardware rental, content development, support services, and staff time. A 90-day pilot with 6 headsets, custom content, and dedicated support runs $35,000-50,000. This investment serves 1,000-1,500 participants, generating per-engagement costs of $25-50.
Engagement value assignment requires connecting VR interactions to revenue outcomes. If VR-engaged leads convert at 15% versus 5% for traditional leads, and average deal size is $10,000, each VR engagement generates $1,500 expected value versus $500 for traditional engagement. The $1,000 lift justifies $100+ per engagement investment.
Break-even analysis for rental versus purchase depends on usage frequency and duration. Daily use for 12+ months favors purchase. Sporadic event deployment favors rental. The break-even point typically occurs at 120-150 days of use annually. Factor in obsolescence, maintenance, and storage costs when calculating total ownership expenses.
Scaling projections based on pilot data should incorporate learning curves and efficiency gains. Second-deployment costs run 30% lower due to content reuse and process optimization. Staff efficiency improves 50% through experience. These improvements enable profitable scaling even with conservative revenue projections.
Scaling from Pilot to Enterprise VR Engagement Program
Once your pilot proves ROI, here’s how to scale VR customer engagement across regions, segments, and touchpoints while maintaining quality and controlling costs.
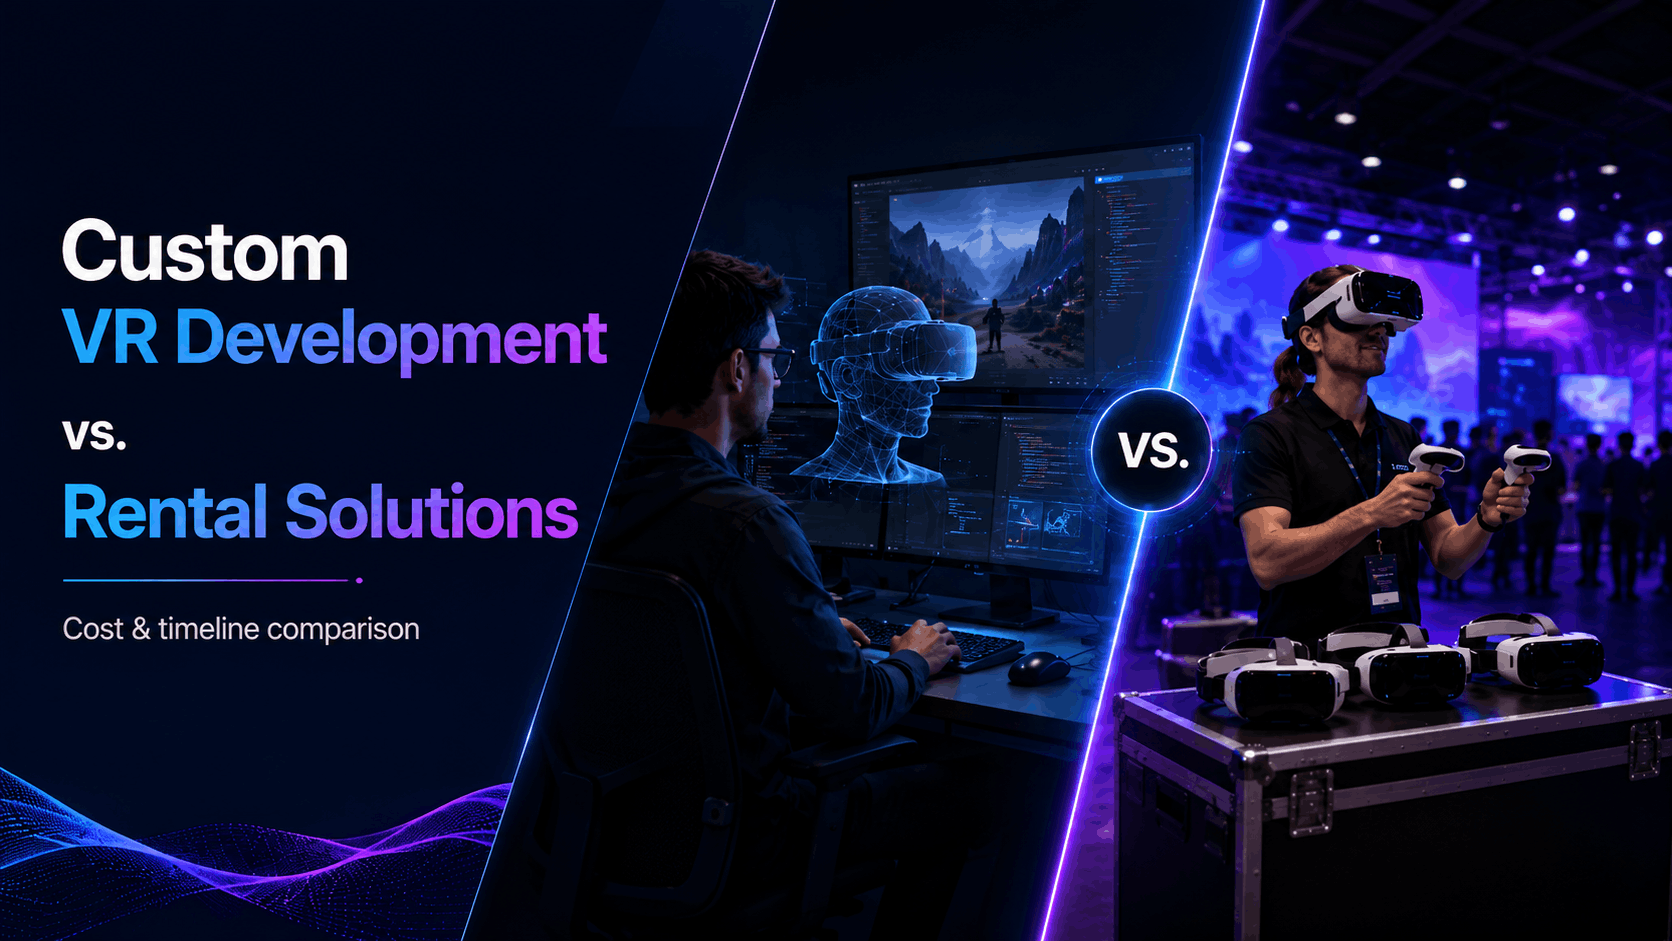
Build vs Rent Decision Framework
Volume thresholds for purchase consideration start at 20 headsets used 150+ days annually. Below this threshold, rental economics remain superior. Above it, ownership delivers 40-60% cost savings over 24 months. Consider hybrid models for organizations with steady baseline needs but periodic peaks.
Total cost of ownership calculations must include hidden expenses. Hardware represents only 30% of program costs. Content updates, device management, storage, shipping, replacement units, and technical support consume the remaining 70%. Budget $15,000-20,000 annually per headset for comprehensive program costs.
Internal capability requirements for ownership include technical support staff, content management expertise, and logistics coordination. Organizations need 0.5 FTE per 20 headsets for basic support, scaling to 2 FTE per 100 headsets for comprehensive programs. Alternatively, managed service providers handle operations for $500-1,000 per headset monthly.
Hybrid models balance flexibility with cost control. Own core headsets for regular use while renting for peak periods. This approach reduces costs 30% versus pure rental while maintaining surge capacity. Many organizations own 60% of peak needs, renting the remainder as required.
Content Strategy for Scaled Deployment
Modular content architecture enables personalization without exponential complexity. Build core experience frameworks with swappable elements for different segments, regions, or products. This approach delivers 80% custom feel at 20% of full custom cost.
Localization extends beyond language translation to cultural adaptation. Successful global deployments adjust visual styles, interaction patterns, and narrative structures for regional preferences. Asian markets prefer more guided experiences while Western markets favor exploration. Budget 15-20% of original development costs per language for quality localization.
Update cycles should align with product launches and campaign calendars. Quarterly content refreshes maintain engagement while controlling costs. Major annual updates introduce new frameworks or experiences. This cadence balances freshness with development efficiency.
User-generated content opportunities transform customers into experience creators. Providing tools for customers to build and share VR content generates authentic engagement while reducing content costs. Fashion brands enabling virtual outfit creation see 10x more engagement than static experiences.
Operational Excellence at Scale
Centralized management models work best for standardized experiences across locations. A central team manages content, monitors performance, and coordinates support. Local teams handle physical deployment and customer interaction. This division optimizes expertise utilization while maintaining consistency.
Distributed management suits organizations with diverse regional needs or autonomous business units. Each region or unit manages its VR program within corporate guidelines. This approach increases agility and local relevance but requires redundant capabilities and risks inconsistency.
Training and certification programs ensure quality at scale. Develop three certification levels: basic operator (4 hours), advanced troubleshooter (8 hours), and program manager (16 hours). Require certification renewal annually. This structure maintains standards while enabling rapid team expansion.
Performance monitoring dashboards track engagement metrics, technical issues, and ROI across deployments. Real-time visibility enables rapid problem resolution and continuous optimization. Successful programs achieve 95% uptime, 90% experience completion rates, and 85% satisfaction scores consistently.
Vendor management for multi-region support requires careful coordination. Establish master service agreements with global providers while maintaining local support relationships. This dual structure ensures both consistency and responsiveness. Budget 15-20% of program costs for vendor management overhead.
Conclusion: Your VR Engagement Transformation Starts Now
VR customer engagement isn’t a future possibility—it’s a present opportunity delivering measurable results today. Organizations deploying VR touchpoints see 3x engagement rates, 2.8x conversion improvements, and 40% higher customer lifetime values. The technology, infrastructure, and expertise exist to start immediately.
Begin with a focused pilot targeting one high-value customer touchpoint. Rent equipment to minimize initial investment while proving ROI. Measure everything—from dwell time to revenue impact. Use pilot data to build the business case for scaling.
The gap between early adopters and laggards widens daily. While competitors debate VR’s potential, forward-thinking brands deploy immersive experiences that create lasting customer connections. The question isn’t whether to adopt VR for customer engagement, but how quickly you can deploy your first pilot.
Ready to launch your VR customer engagement pilot? Start by identifying your highest-impact customer touchpoint, allocating $25,000-40,000 for a 90-day pilot, and partnering with a VR rental provider who includes content and support. Within 90 days, you’ll have the data, experience, and confidence to scale VR engagement across your entire customer journey.
FAQs
What’s the minimum budget for a VR customer engagement pilot program?
A meaningful pilot program starts at $15,000 for a 30-day deployment with 3-4 headsets, basic content customization, and essential support. This budget serves 200-300 participants and generates sufficient data for initial ROI calculations. More comprehensive 90-day pilots with 6-8 headsets and custom content run $25,000-40,000.
How many VR headsets do I need for a 3-day trade show activation?
Calculate based on expected booth traffic and desired capture rate. For a trade show with 5,000 attendees where you expect 1,000 booth visitors, you need 6-8 headsets to engage 40-50% of visitors. Each headset handles 50-60 experiences daily with proper rotation and hygiene protocols.
Can VR engagement data integrate with Salesforce or HubSpot?
Yes, modern VR platforms offer native integrations with major CRM systems. Platforms like ArborXR, ManageXR, and custom enterprise solutions push engagement data, lead information, and behavioral metrics directly to Salesforce, HubSpot, Marketo, and other systems via API connections or webhook integrations.
What’s the average setup time for a VR customer engagement station?
Initial station setup takes 45-60 minutes including space preparation, equipment configuration, and testing. Daily setup for events requires 15-20 minutes for charging, cleaning, and content verification. Breakdown takes 20-30 minutes including proper packing for transport or storage.
How do you handle hygiene concerns with shared VR headsets?
Implement three-layer protection: UV-C sanitization boxes (60-second cycles between users), disposable face covers (replaced each use), and antibacterial wipes for external surfaces. This protocol exceeds health guidelines while maintaining 12-15 users per hour throughput. Budget $2-5 per user for hygiene supplies.
What’s the typical learning curve for staff managing VR experiences?
Staff achieve basic competency in 2-4 hours of training, covering headset operation, common troubleshooting, and hygiene protocols. Advanced troubleshooting and content management require an additional 4-6 hours. Most staff feel fully confident after managing 20-30 customer interactions.
Should we create custom VR content or use existing experiences?
Start with modified existing experiences for pilots to minimize cost and deployment time. Licensed content with brand customization costs $5,000-25,000 and deploys in 2-4 weeks. Reserve full custom development ($50,000-250,000) for proven use cases where unique experiences drive competitive advantage.
How do you measure emotional engagement in VR experiences?
Combine quantitative biometric data with qualitative observation. Eye tracking reveals attention patterns, hand tracking shows interaction confidence, and built-in sensors detect head movement indicating interest or confusion. Supplement with post-experience surveys focusing on specific emotional responses rather than general satisfaction.