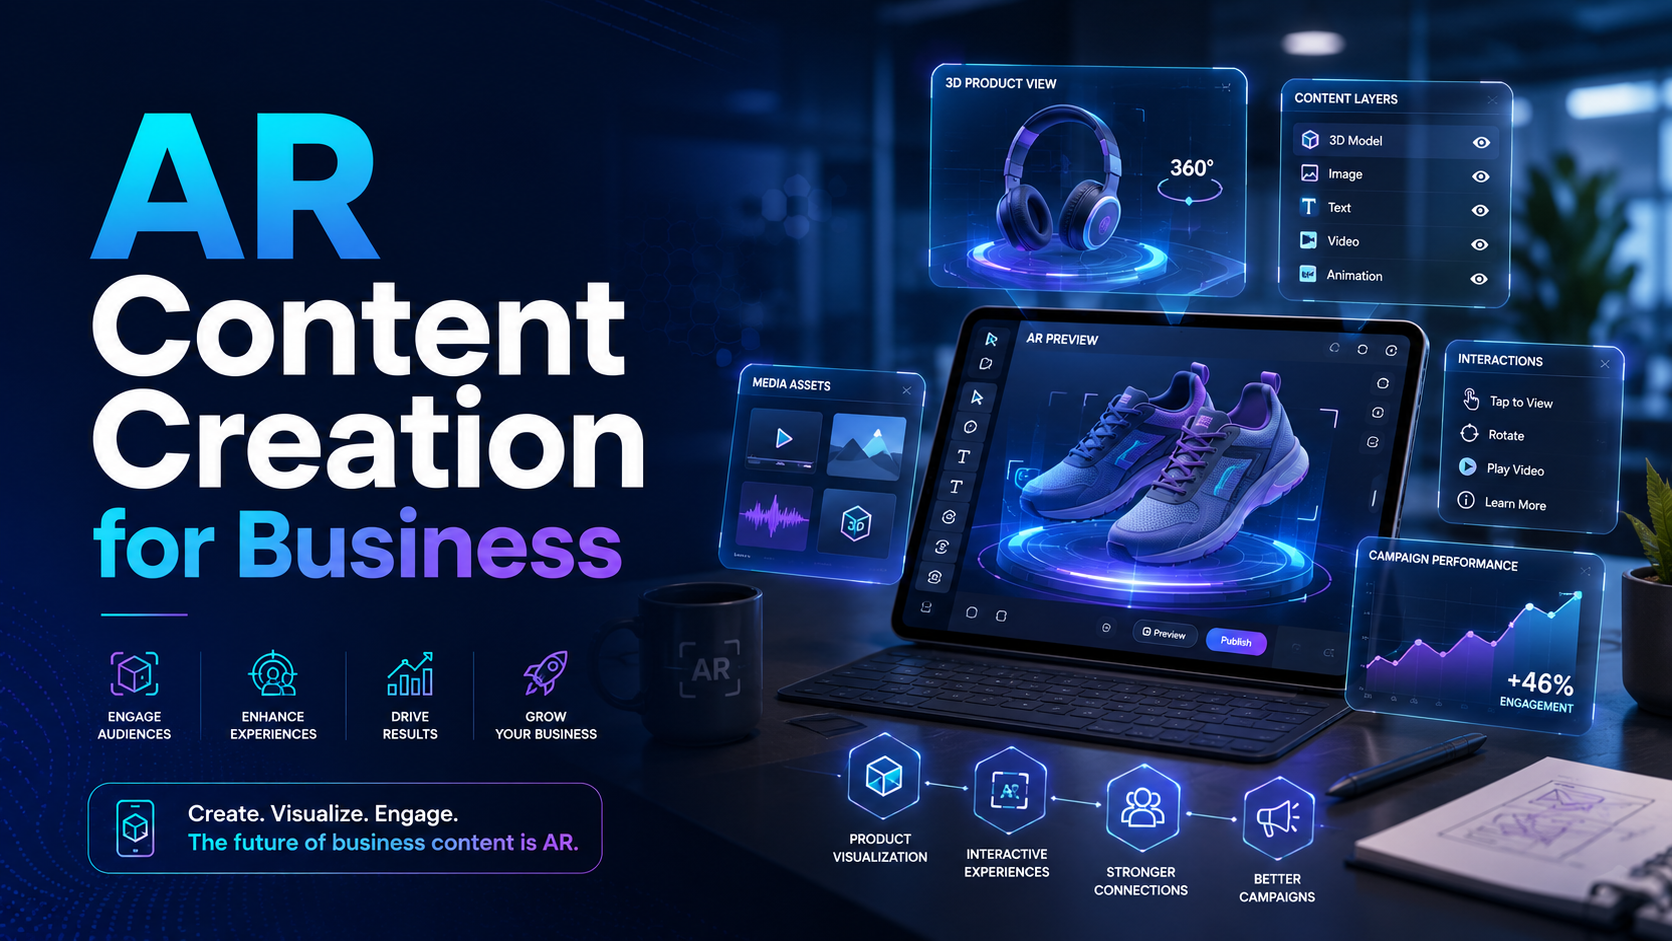
Augmented reality content creation has emerged as a practical alternative to traditional training materials and event experiences, with deployment times measured in weeks rather than months. Unlike VR development’s complex world-building requirements, AR content creation leverages existing physical spaces and runs on standard smartphones, making it accessible to businesses without specialized hardware investments.
The AR content creation landscape offers multiple entry points for businesses, from no-code platforms that launch in under two weeks to enterprise-grade solutions supporting thousands of simultaneous users. This guide examines the tools, workflows, and deployment economics that determine successful AR implementation for corporate training, sales enablement, and event activation.
AR Content Creation vs. VR Development: Speed, Cost, and Deployment Differences
AR content creation operates on fundamentally different economics than VR development. Where VR requires headsets, controlled environments, and complex 3D worlds, AR layers digital content onto existing spaces using smartphones, tablets, or AR glasses. This section breaks down the practical differences in creation time, deployment complexity, and hardware requirements that make AR faster to launch for many business use cases.
Development Timeline Comparison: 2 Weeks for AR vs. 8 Weeks for VR
AR marker-based experiences can launch in 10-14 days using templates from platforms like 8th Wall or Zapworks. These rapid deployment timelines stem from AR’s reliance on existing environments rather than creating entire virtual worlds. A typical AR product visualization experience requires only the 3D model, trigger image, and interaction logic—components that template-based systems can configure in hours rather than weeks.
VR environments demand full 3D world construction, including backgrounds, lighting systems, physics simulations, and spatial audio design. Each environment requires optimization for different headset specifications, adding weeks to development cycles. While a VR training simulation might need custom-built factory floors or office spaces, AR training overlays digital instructions directly onto real equipment.
AR development also benefits from reusable component libraries. Once a company creates AR buttons, menus, or information panels, these elements transfer across multiple experiences. This modular approach reduces subsequent project timelines to 5-7 days for similar use cases.
Hardware Requirements and Audience Reach
AR content runs on over 3 billion smartphones globally, requiring only a camera and motion sensors standard in devices from the past five years. This existing hardware base eliminates the $300-3,500 per-headset investment VR demands. Employees and customers already carry AR-capable devices, removing hardware as a deployment barrier.
For hands-free industrial applications, AR glasses like HoloLens 2 or Magic Leap 2 offer specialized solutions. These devices rent for $500-1,500 per unit per week for events, compared to purchasing at $3,500-4,500 each. Rental packages include preloaded content, technical support, and shipping logistics, making them practical for periodic training sessions or trade show activations.
The bring-your-own-device (BYOD) model works particularly well for AR training programs. Companies distribute AR content through QR codes or web links, allowing employees to access training materials on personal devices. This approach eliminates hardware management while maintaining security through cloud-based content delivery systems that don’t store sensitive data on personal devices.
Content Complexity and Maintenance
AR content updates through cloud-based platforms without requiring app updates or reinstallation. When product specifications change or training procedures update, content managers modify the AR experience through web dashboards. These changes propagate instantly to all users, maintaining version consistency across global deployments.
Version control for AR overlays proves simpler than VR environment management. AR experiences typically involve 10-50 discrete assets (3D models, videos, text overlays) compared to VR’s hundreds of environmental elements. This reduced complexity translates to faster quality assurance cycles and fewer compatibility issues across devices.
QR code or image trigger deployment eliminates app store approval processes that can delay VR content distribution by 2-7 days. Businesses print new QR codes or update trigger images to launch revised AR experiences immediately. This flexibility proves valuable for event-specific content or time-sensitive training materials.
Business Use Cases Driving AR Content Creation
AR content creation splits into four primary business applications, each with distinct tools and deployment methods. Understanding your use case determines whether you need markerless tracking, cloud anchors, or simple image recognition.
Product Visualization and Sales Enablement
AR product visualization allows customers to place full-scale 3D models in their actual spaces before purchasing. Furniture retailers report 40% fewer returns when customers use AR preview features, as buyers can verify size, color, and style compatibility with existing décor. These experiences require photorealistic 3D models optimized for mobile rendering, typically 5-10MB per product to ensure smooth performance.
AR configurators extend visualization with real-time customization options. Customers select colors, materials, and features while viewing products in their environment. Each configuration saves to customer profiles, enabling sales teams to follow up with personalized quotes. Integration with CRM systems like Salesforce or HubSpot tracks AR engagement metrics, identifying high-intent prospects based on interaction time and configuration complexity.
B2B sales teams use AR to demonstrate industrial equipment that’s impractical to transport. A single tablet replaces truckloads of demonstration units, while AR animations show internal mechanisms and operational sequences impossible to display with physical products. These AR sales tools reduce travel costs while increasing demonstration frequency.
Training Overlays and Work Instructions
AR work instructions overlay step-by-step guidance directly onto equipment, reducing training time by 30-50% compared to traditional manuals. Technicians point devices at machinery to see wire diagrams, torque specifications, and assembly sequences positioned exactly where needed. This spatial context eliminates the cognitive load of translating 2D diagrams to 3D equipment.
Remote assistance capabilities allow experts to guide field technicians through AR annotation tools. The expert sees the technician’s camera view and draws arrows, circles, or text that appear as AR overlays in the technician’s environment. This real-time collaboration reduces equipment downtime and travel costs for specialized support.
Performance tracking through AR interactions provides granular training analytics. Systems record completion times, error rates, and help request frequency for each procedure step. This data identifies knowledge gaps and optimizes training content based on actual user behavior rather than assumptions.
Event Activations and Brand Experiences
AR photo opportunities at events generate social media content while collecting participant data. Attendees scan QR codes to launch AR experiences that place them next to virtual products, characters, or branded environments. These experiences include built-in sharing features that post to social platforms while capturing email addresses for follow-up marketing.
Gamified AR scavenger hunts drive booth traffic at trade shows by encouraging attendees to find AR markers throughout the venue. Each discovered marker unlocks product information, contest entries, or virtual collectibles. Completion rates of 60-80% demonstrate AR’s ability to maintain engagement across multi-hour events.
Virtual product launches use AR portals to transport viewers into immersive brand experiences without leaving the exhibition floor. Attendees step through AR doorways to explore virtual showrooms, watch product demonstrations, or access exclusive content. These portal experiences combine the accessibility of AR with the immersion typically associated with VR.
Wayfinding and Facility Navigation
Indoor navigation through AR eliminates the confusion of traditional maps in complex facilities. Hospitals, airports, and corporate campuses deploy AR wayfinding that displays directional arrows and distance markers overlaid on the actual environment. Users follow AR paths to destinations without interpreting abstract floor plans.
AR directories in retail environments help customers locate products while promoting special offers along the route. The system calculates optimal paths through stores, increasing exposure to promotional items. Integration with inventory systems ensures AR navigation only directs customers to in-stock items.
Accessibility features through AR visual aids assist users with disabilities in navigating spaces. AR can highlight obstacles, identify elevator locations, or provide audio descriptions of surroundings. These inclusive design features expand facility access while demonstrating corporate commitment to accessibility.
AR Content Creation Tools: No-Code vs. Developer Platforms
The AR creation tool landscape divides into three tiers based on technical requirements and output quality. Most businesses start with no-code platforms for pilot programs before evaluating custom development needs.
No-Code AR Platforms for Business Teams
Zapworks Studio offers drag-and-drop AR creation with prebuilt templates for common business use cases. The platform includes image tracking, world tracking, and face tracking capabilities without coding requirements. Pricing starts at $145 per month for small teams, scaling to $745 monthly for enterprise features including analytics and white-labeling options.
Blippar’s Blippbuilder provides a web-based interface for creating AR experiences in under an hour. The platform specializes in marketing campaigns and product packaging AR, with built-in social sharing and e-commerce integrations. Plans range from $99 monthly for basic features to $499 for advanced analytics and unlimited publishes.
8th Wall focuses on WebAR creation, eliminating app downloads through browser-based experiences. The platform’s Cloud Editor enables real-time collaboration between team members, while the $99 monthly starter plan includes 1,000 views. Commercial plans at $490 monthly support unlimited views and custom domains.
Low-Code Solutions for Designers
Adobe Aero integrates with Creative Cloud workflows, allowing designers to import Photoshop and Illustrator assets directly into AR scenes. The tool requires no coding for basic interactions but supports behavior scripting for complex sequences. Aero comes free with Creative Cloud subscriptions, making it cost-effective for teams already using Adobe products.
Spark AR creates social media filters for Instagram and Facebook, reaching billions of users through existing platforms. While primarily consumer-focused, businesses use Spark AR for branded filters that promote products or events. The platform remains free but requires Facebook approval for public filter distribution.
Unity with AR Foundation provides a middle ground between visual tools and code-based development. Designers can use Unity’s visual scripting system for logic while developers add custom functionality through C#. Unity’s free tier supports projects under $100,000 annual revenue, with Plus subscriptions at $399 per seat annually for larger businesses.
Enterprise AR Development Platforms
PTC Vuforia specializes in industrial AR applications with advanced computer vision capabilities. The platform’s Model Targets recognize complex machinery from any angle, while Area Targets enable persistent AR in large facilities. Vuforia Engine starts at $499 monthly, with Vuforia Studio for no-code creation at $2,100 monthly.
Microsoft Mixed Reality Toolkit targets HoloLens 2 and other AR glasses platforms. The open-source framework provides enterprise-grade features including hand tracking, voice commands, and spatial mapping. While the toolkit is free, HoloLens 2 development requires $3,500 hardware investment plus Visual Studio licensing.
Custom ARCore (Android) and ARKit (iOS) development offers maximum flexibility but requires experienced developers. Native development enables advanced features like persistent cloud anchors, multi-user sessions, and custom computer vision algorithms. Development costs range from $75-200 hourly for qualified AR developers, with projects typically requiring 200-800 hours.
AR Content Deployment: Distribution Methods and Hardware Options
Getting AR content to end users requires choosing between web-based AR (WebAR), native apps, or AR glasses deployment. Each path has distinct setup requirements, user friction points, and scalability limits.
WebAR: Instant Access Through Browsers
WebAR eliminates download friction by running directly in mobile browsers. Users scan QR codes or click links to launch AR experiences within 3-5 seconds. This immediate access proves crucial for event activations where attendees won’t download apps for single-use experiences.
Browser limitations restrict WebAR to simpler experiences compared to native apps. File size limits of 10-15MB constrain 3D model detail, while browser security prevents access to advanced device features. WebAR works best for marketing campaigns, product previews, and simple training overlays rather than complex multi-user experiences.
Cross-platform compatibility varies between browsers, with Safari supporting different WebAR features than Chrome. Testing across iOS Safari, Chrome, and Samsung Internet browsers ensures consistent experiences for 95% of mobile users. Progressive enhancement strategies display simplified experiences on older devices while enabling full features on capable hardware.
Native AR Apps: Full Feature Access
Native apps access platform-specific AR capabilities including persistent cloud anchors, advanced occlusion, and multi-user sessions. ARCore on Android and ARKit on iOS provide optimized performance with 60fps rendering and minimal battery drain. These advantages justify app installation friction for frequently-used training or sales tools.
App store distribution requires 2-7 day approval processes that can delay urgent deployments. Enterprise distribution through mobile device management (MDM) systems bypasses public app stores but requires IT infrastructure. Both paths involve update management as AR frameworks evolve quarterly with new device releases.
Native apps support offline functionality crucial for field deployments without reliable internet. Content downloads to devices for access in remote locations, with usage data syncing when connections restore. This offline capability proves essential for industrial training and field service applications.
AR Glasses Deployment for Hands-Free Use
HoloLens 2 and Magic Leap 2 enable hands-free AR for industrial applications where holding devices proves impractical or unsafe. These devices overlay digital information directly in users’ field of view while maintaining peripheral awareness. Rental programs at $500-1,500 weekly per device make AR glasses accessible for periodic training or events without capital investment.
Preloaded content management for AR glasses fleets requires specialized deployment tools. Microsoft Endpoint Manager configures HoloLens 2 devices remotely, while Magic Leap’s Device Manager handles Magic Leap 2 deployments. These systems push content updates, manage user accounts, and monitor device health across distributed installations.
Training requirements for AR glasses exceed smartphone AR due to unfamiliar interaction paradigms. Users need 15-30 minutes to learn hand gestures, voice commands, and gaze controls. On-site support staff familiar with AR glasses troubleshooting proves essential for smooth event deployments.
AR Content Production Workflow: From Concept to Launch
A typical AR content creation project follows a five-phase workflow, with most business projects completing in 2-6 weeks depending on complexity and approval cycles.
Phase 1: Use Case Definition and Platform Selection
Successful AR projects begin with device audits confirming target audience hardware capabilities. Analytics tools reveal iOS/Android distribution, device models, and AR framework support across user populations. This data informs platform selection between WebAR’s broad compatibility and native apps’ advanced features.
Success metrics definition establishes measurable goals beyond engagement vanity metrics. Training applications might track task completion accuracy and time-to-competency. Sales tools measure conversion rates and average deal sizes. Event activations count social shares and lead capture rates. These KPIs guide design decisions throughout development.
Platform selection balances technical requirements against deployment constraints. Simple visualization needs might use no-code WebAR platforms, while multi-user training scenarios require native development. Budget, timeline, and internal technical capabilities factor into platform decisions that impact the entire project lifecycle.
Phase 2: Content Asset Preparation
3D model optimization for mobile AR requires balancing visual quality against performance constraints. Models should stay under 100,000 polygons with 2K textures to maintain 60fps on mid-range devices. Automated optimization tools like Simplygon reduce polygon counts while preserving visual fidelity, though manual optimization produces superior results for hero assets.
Image target selection for marker-based AR impacts tracking reliability across lighting conditions. High-contrast images with distinctive features track better than simple logos or text. Target images need testing across expected viewing distances and angles. Print quality affects tracking stability, with matte finishes performing better than glossy surfaces that create reflections.
Animation and interaction specifications document user flows through AR experiences. Storyboards illustrate each interaction state, while technical specifications detail trigger conditions and response behaviors. These documents align stakeholders before development begins, reducing revision cycles during production.
Phase 3: AR Experience Assembly
Scene setup positions virtual content relative to physical anchors or image markers. Proper scaling ensures virtual objects appear naturally sized in real environments. Lighting configuration matches virtual illumination to physical conditions, improving visual integration. These foundational decisions impact the entire experience’s believability.
Interaction triggers define how users engage with AR content through taps, gestures, or proximity. Touch targets need 44×44 pixel minimum sizes for reliable selection on mobile devices. Gesture recognizers must account for varied hand sizes and movement speeds. Proximity triggers require careful tuning to prevent unintended activations.
Multi-user session configuration enables collaborative AR experiences where participants see synchronized content. Cloud anchor services from Google or Azure maintain spatial alignment across devices. Network architecture must handle real-time state synchronization with 50-100ms latency for smooth interactions. These technical requirements significantly impact hosting infrastructure needs.
Phase 4: Testing and Optimization
Device compatibility testing spans the fragmented Android ecosystem and multiple iOS generations. Test matrices cover the top 20 device models representing 80% of target users. Automated testing services like AWS Device Farm accelerate compatibility validation, though manual testing catches nuanced issues automated systems miss.
Lighting and tracking stability tests evaluate AR experiences across expected environmental conditions. Outdoor deployments need testing in bright sunlight and shadows. Indoor experiences require validation under fluorescent, LED, and natural lighting. Tracking must remain stable despite partial occlusions and rapid device movements common in real usage.
Performance optimization targets 60fps frame rates while minimizing battery drain and thermal buildup. Profiling tools identify rendering bottlenecks and memory leaks that degrade experiences over time. Level-of-detail systems dynamically adjust quality based on device capabilities and thermal states. These optimizations extend session lengths crucial for training and event applications.
Phase 5: Deployment and Analytics Setup
Distribution channel configuration depends on chosen deployment methods. WebAR experiences need CDN setup for global content delivery with <100ms latency. Native apps require app store listings with optimized descriptions and screenshots for discovery. Enterprise deployments configure MDM systems for managed distribution.
Analytics integration tracks engagement metrics essential for ROI demonstration. Google Analytics or Mixpanel capture standard events like session duration and interaction counts. Custom events track business-specific metrics like training module completion or product configuration combinations. Real-time dashboards enable event staff to monitor and adjust activations dynamically.
Content update systems maintain experiences post-launch without redistribution. Cloud-based content management platforms push new 3D models, videos, or text without app updates. Version control systems track changes and enable rollbacks if issues arise. These systems prove essential for seasonal campaigns and evolving training content.
Rental vs. Build Economics for AR Content Programs
The decision between renting AR-ready packages versus building custom content depends on program frequency, audience size, and content refresh requirements. Most businesses benefit from rental packages for pilots before committing to custom development.
AR Rental Packages: Turnkey Content and Hardware
Preloaded AR experiences on rental devices start at $150 daily for basic packages including 10 tablets with standard AR demos. Premium packages at $500-1,000 daily include custom-branded experiences, on-site support, and analytics reporting. These turnkey solutions deploy within 48 hours for last-minute event needs.
Managed deployment services handle logistics beyond equipment rental. Service providers manage device charging, content updates, and troubleshooting during events. Staff training ensures smooth handoffs to booth personnel unfamiliar with AR technology. This full-service approach costs $2,000-5,000 per event day but eliminates technical risks.
Rental packages excel for proof-of-concept deployments before custom development investment. Businesses test AR reception with target audiences using generic experiences modified with company branding. Feedback from rental deployments informs custom content requirements and expected engagement levels.
Custom AR Development Cost Breakdown
Simple AR experiences like product visualizations or image-triggered videos cost $5,000-15,000 for custom development. These projects include 3-5 3D models, basic interactions, and standard UI elements. Development takes 2-3 weeks with one revision round included.
Complex multi-user AR experiences range from $25,000-75,000 depending on feature requirements. Custom computer vision algorithms, real-time networking, and platform-specific optimizations drive costs higher. These projects require 6-12 weeks including extensive testing across device types and network conditions.
Ongoing hosting and maintenance runs $500-2,000 monthly based on user volume and update frequency. Costs include cloud infrastructure, CDN delivery, analytics services, and technical support. Content updates beyond minor text changes incur additional hourly charges at $100-200 per hour.
Hybrid Approach: Renting for Pilots, Building for Scale
Initial rental deployments validate AR use cases with minimal risk. Three-month rental pilots cost $5,000-10,000 versus $25,000+ for custom development. This approach tests multiple AR concepts before selecting the most effective for custom development.
User feedback from rentals shapes custom content requirements. Analytics reveal which features drive engagement and which create friction. Survey responses identify missing functionality worth development investment. This data-driven approach reduces custom development failure risk.
The transition from rental to owned content occurs when monthly rental costs exceed amortized development costs. For programs running quarterly or more frequently, custom development pays back within 12-18 months. Annual programs might continue renting indefinitely unless content requirements become highly specific.
Measuring AR Content Creation Success
AR content effectiveness requires tracking beyond traditional engagement metrics. Successful programs measure business impact through completion rates, knowledge retention, and conversion improvements. Training programs using AR report 70% faster task completion and 40% fewer errors compared to traditional methods.
Analytics platforms built into AR creation tools provide baseline metrics including session duration, interaction counts, and drop-off points. Advanced implementations integrate with business intelligence systems to correlate AR engagement with sales outcomes or training certifications. This connection between AR interaction and business results justifies continued investment.
Long-term success depends on content refresh strategies that maintain user interest. AR experiences that remain static lose 50% engagement after three uses. Regular content updates, seasonal themes, and gamification elements sustain engagement over extended deployments. Budget 20-30% of initial development costs annually for content refreshing and platform updates.
Conclusion
AR content creation for business has matured beyond experimental pilots into production-ready solutions with predictable costs and timelines. The combination of no-code creation tools, smartphone ubiquity, and cloud-based deployment makes AR accessible to businesses without specialized technical teams. Companies can launch AR initiatives in weeks rather than months, testing use cases through rental packages before investing in custom development.
The key to successful AR content creation lies in matching tools and deployment methods to specific business objectives. Simple visualization needs leverage template-based platforms, while complex training scenarios justify custom development. WebAR removes friction for one-time event activations, while native apps provide rich functionality for daily-use tools.
As AR creation tools continue democratizing development and AR glasses approach mainstream adoption, businesses that build AR content capabilities now will maintain competitive advantages as spatial computing becomes standard. The question is no longer whether to create AR content, but which use cases to prioritize and whether to rent or build for your specific needs.
Ready to explore AR content creation for your business? Start with a rental pilot to validate your use case, then transition to custom development once you’ve proven ROI. Contact AR platform providers for demos tailored to your industry, and begin building the spatial computing capabilities your organization will need for the next decade of digital transformation.
Frequently Asked Questions
What’s the difference between AR and VR content creation?
AR content creation overlays digital elements onto real environments using existing devices like smartphones, taking 2-4 weeks to develop. VR creates entirely virtual worlds requiring specialized headsets and 8-12 weeks of development for immersive environments.
How much does AR content creation cost for businesses?
Basic AR experiences cost $5,000-15,000 for custom development or $99-499 monthly for no-code platforms. Complex multi-user AR ranges from $25,000-75,000, while rental packages start at $150 per day for events.
Can I create AR content without coding experience?
Yes, no-code platforms like Zapworks, Blippar, and 8th Wall offer drag-and-drop interfaces with templates. These tools enable business teams to create AR experiences in hours without technical expertise.
What hardware do users need to view AR content?
Most AR content runs on smartphones from the past 5 years with cameras and motion sensors. AR glasses like HoloLens 2 provide hands-free experiences but aren’t required for most business applications.
How long does it take to create custom AR content?
Simple AR experiences launch in 10-14 days using templates, while custom development takes 2-6 weeks depending on complexity. Multi-user or industrial AR applications may require 8-12 weeks.
Should I use WebAR or native apps for business AR?
WebAR works best for marketing campaigns and events where users won’t download apps. Native apps suit frequently-used training tools or sales applications requiring advanced features and offline functionality.
What AR creation tools work best for training content?
PTC Vuforia and Microsoft Mixed Reality Toolkit excel for industrial training, while Zapworks and 8th Wall suit general business training. Adobe Aero works well for creative teams already using Creative Cloud.
Can AR content work on both iOS and Android devices?
Yes, most AR platforms support both iOS (ARKit) and Android (ARCore) devices. WebAR provides the broadest compatibility, while native development may require platform-specific optimizations.